On May 13, 2026, the ELISA Project hosted a seminar exploring how open source technologies including Xen, Zephyr RTOS, and Linux are advancing toward deployment in safety-critical systems across avionics, automotive, and industrial domains.
The session featured Ayan Kumar Halder (AMD) and Matthew Weber (Boeing), who shared ongoing collaborative work around functional safety, mixed-criticality systems, and open source safety certification efforts.
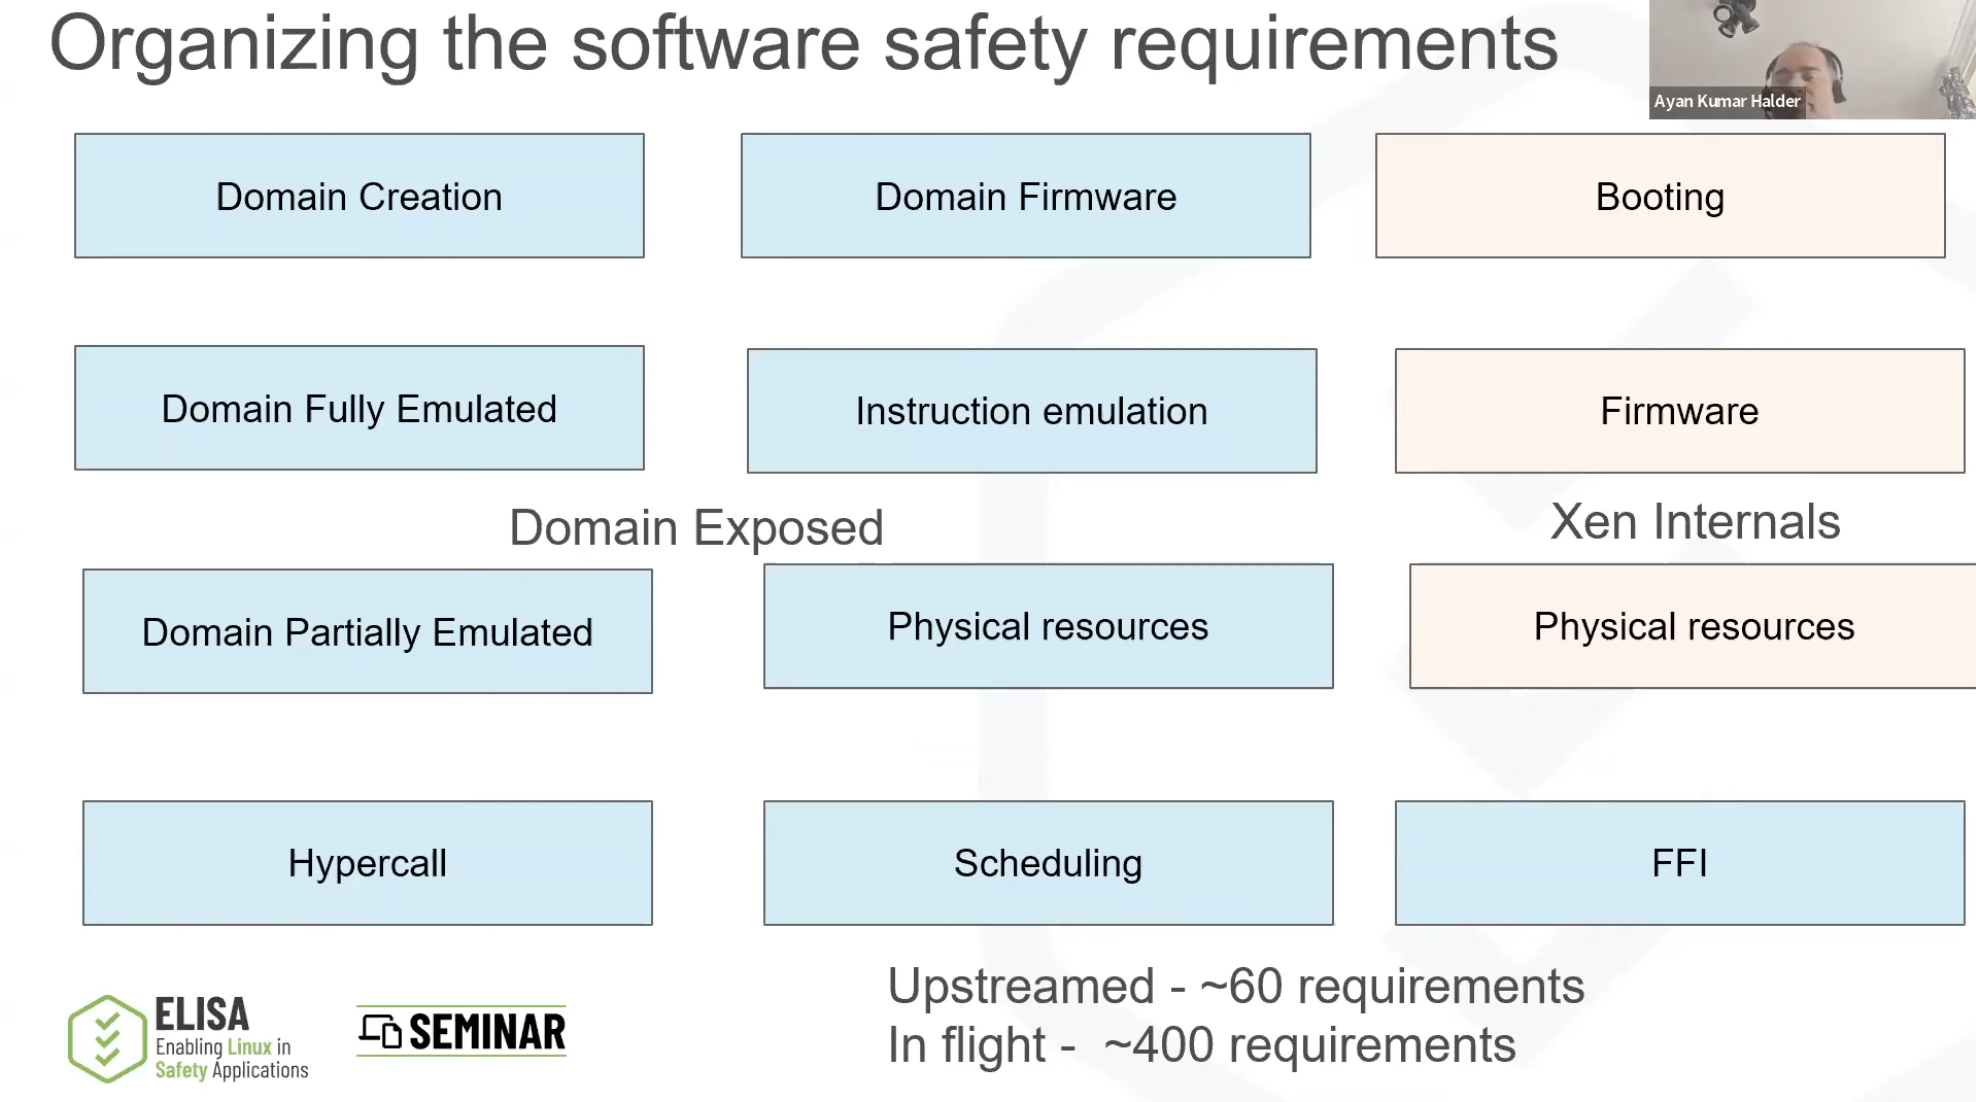
The discussion focused on how Xen, Zephyr, and Linux can be composed into a unified architecture for safety-critical environments. The speakers outlined how Xen can act as a Type-1 hypervisor, isolating workloads with different safety requirements while supporting deterministic execution, static partitioning, and freedom from interference between virtual machines.
A major theme throughout the session was the growing collaboration between the Xen community and the ELISA Project to build an open functional safety ecosystem. The work spans multiple safety standards including ISO 26262, IEC 61508, and DO-178C, with the goal of creating reusable safety certification artifacts and methodologies that can benefit multiple industries.
The seminar highlighted several ongoing technical efforts within the Xen functional safety initiative, including:
MISRA C compliance improvements and automated CI checking
MPU support for ARM Cortex-R systems
Static partitioning and deterministic scheduling
Requirements traceability and architecture specifications
Domain-based testing, fault injection, fuzzing, and unit testing
White-box testing approaches using Ceedling and coverage analysis
Open source traceability workflows using Open Fast Trace
The speakers also discussed the importance of defining assumptions of use (AoU) between system components such as firmware, hypervisors, operating systems, and applications. This systems-level perspective is critical for enabling Linux and Xen to operate within certified safety environments.
Matthew Weber shared additional insights from the aerospace domain, explaining how avionics standards such as DO-178C and ARINC 653 complement ongoing automotive safety efforts. The session explored how higher levels of testing rigor, deterministic partitioning, and lifecycle traceability can help support mixed-criticality aerospace systems using open source technologies.
Another key discussion point was sustainability. Functional safety is not a one-time activity but an ongoing engineering process that must evolve alongside code changes, new features, and emerging defects. The speakers emphasized the importance of open collaboration, transparent development processes, and community participation to keep safety-related artifacts and testing continuously maintained.
The session concluded with an invitation for the broader community to get involved through mailing lists, workshops, Git repositories, and upcoming events including the Xen Summit and ELISA workshops.
As open source continues expanding into regulated and safety-critical industries, collaborations like these are helping create the technical foundations, tooling, and community processes needed to support the next generation of safety-focused systems.
Watch for upcoming ELISA seminars and community workshops to continue the conversation around functional safety, mixed-criticality systems, and open source collaboration.
On February 11–12, the ELISA Project community gathered for the 2026 Working Group (WG) and Special Interest Group (SIG) Annual Updates. Over two focused sessions, group leads shared key milestones from 2025, current technical priorities, and what lies ahead in 2026, along with concrete opportunities for collaboration and contribution.
The annual updates serve as a checkpoint for the project: a moment to reflect on progress, align on priorities, and welcome new contributors into the work of advancing Linux in safety-critical systems.
This week we highlight the session on Safety Critical Linux Features by Alessandro Carminati, NVIDIA.
As part of the ELISA Project Working Group and Special Interest Group Annual Updates held on February 11–12, 2026, Alessandro Carminati (NVIDIA) presented the latest progress from the Linux Features for Safety-Critical Systems (LFSCS) Working Group, outlining 2025 activities, current technical investigations, and priorities for 2026.
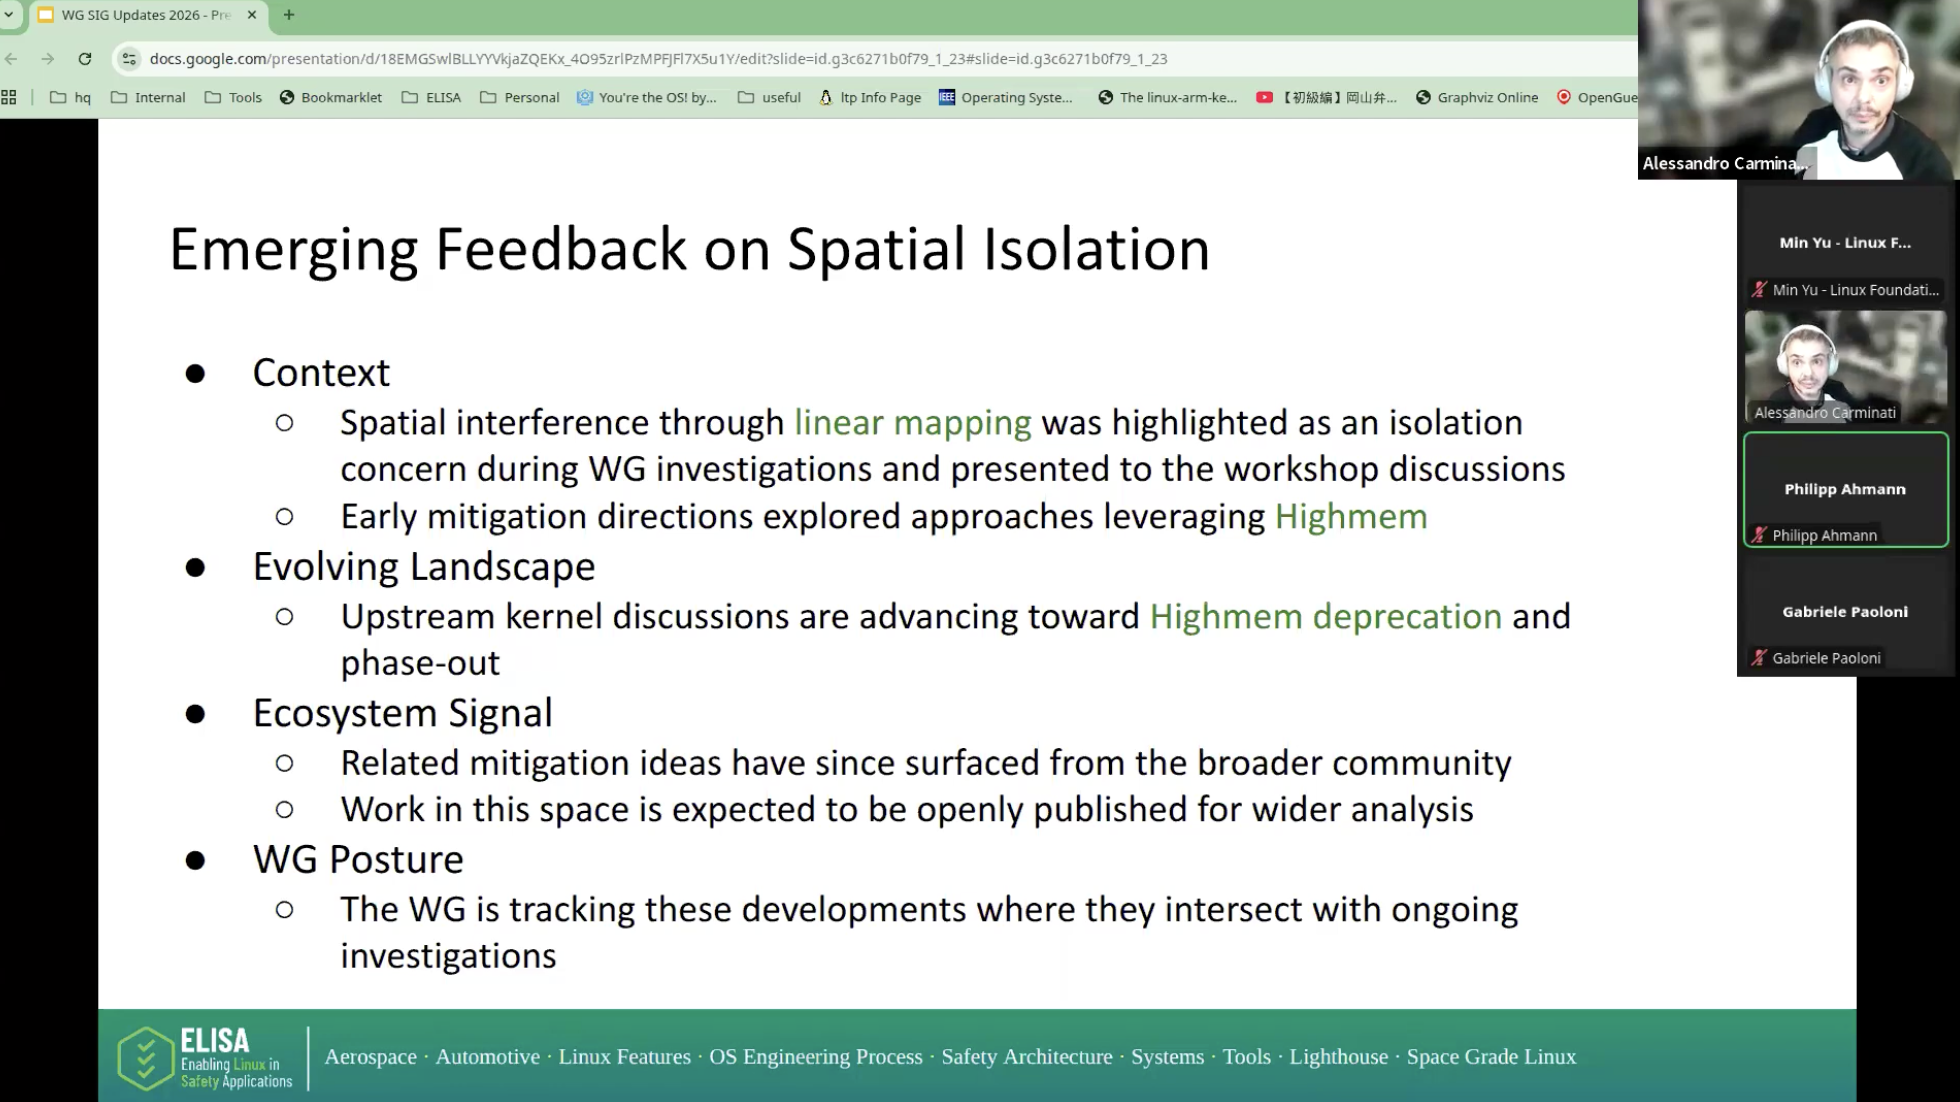
The LFSCS Working Group approaches Linux from a safety perspective by asking not whether it works, but how it could fail within a safety-critical system. Its role is not to certify systems or build safety cases, but to investigate Linux kernel and, where relevant, user space behavior to identify where safety assumptions may break. The group focuses on areas such as memory isolation, allocation behavior, and process boundaries domains where failures could have real safety implications. These investigations are translated into structured scenarios and reproducible technical questions that can be shared across the open source ecosystem.
Operating as a horizontal working group within ELISA, LFSCS works across domains including automotive, aerospace, and industrial systems. Vertical working groups bring real-world requirements, and LFSCS maps those needs to Linux features, identifying where implementation details or system behavior may challenge safety expectations. This model allows the group to build a foundational understanding of safety-relevant Linux behavior that can be reused and validated across industries.
Key work in 2025:
In 2025, the group focused on several key technical areas driven by emerging questions and contributor input. One major effort examined the concept of a minimal Linux footprint identifying the smallest functional system required for safety-critical deployments by tracing real application behavior and mapping which kernel features are actually used. This work helps reduce system complexity and provides insight into the runtime surface exposed in safety environments. Another central investigation focused on memory isolation, particularly Virtual Memory Areas (VMAs), which are core to process and context separation in Linux. The group analyzed lifecycle behavior, mapping evolution, allocation interactions, and system behavior under stress to better understand isolation guarantees and where flexibility in the system may conflict with deterministic safety expectations. In addition, exploratory topics such as pointer safety models were discussed, reflecting the group’s openness to contributor-driven ideas and emerging areas of interest.
The output of the LFSCS Working Group is primarily investigative and is shared through documentation, workshops, and public discussions to ensure visibility and reuse. The session also emphasized the importance of collaboration, particularly with other working groups, to connect analytical findings with tooling and reproducible validation.
Looking ahead to 2026, the group will continue advancing analysis of Linux features in safety contexts, expanding collaboration across domains, supporting integration with tooling efforts, and encouraging community participation.
The working group meets regularly and welcomes contributors through meetings, mailing lists, and GitHub. This session highlighted how LFSCS is building a deeper technical understanding of Linux behavior in safety-critical systems helping the ecosystem better identify risks and support the adoption of Linux where safety is essential.
Learn more about the ELISA Project and how to get involved.
On February 11–12, the ELISA Project community gathered for the 2026 Working Group (WG) and Special Interest Group (SIG) Annual Updates. Over two focused sessions, group leads shared key milestones from 2025, current technical priorities, and what lies ahead in 2026, along with concrete opportunities for collaboration and contribution.
The annual updates serve as a checkpoint for the project: a moment to reflect on progress, align on priorities, and welcome new contributors into the work of advancing Linux in safety-critical systems.
This week we highlight the session on ELISA Lighthouse Special Interests Group presented by Philipp Ahmann, ETAS.
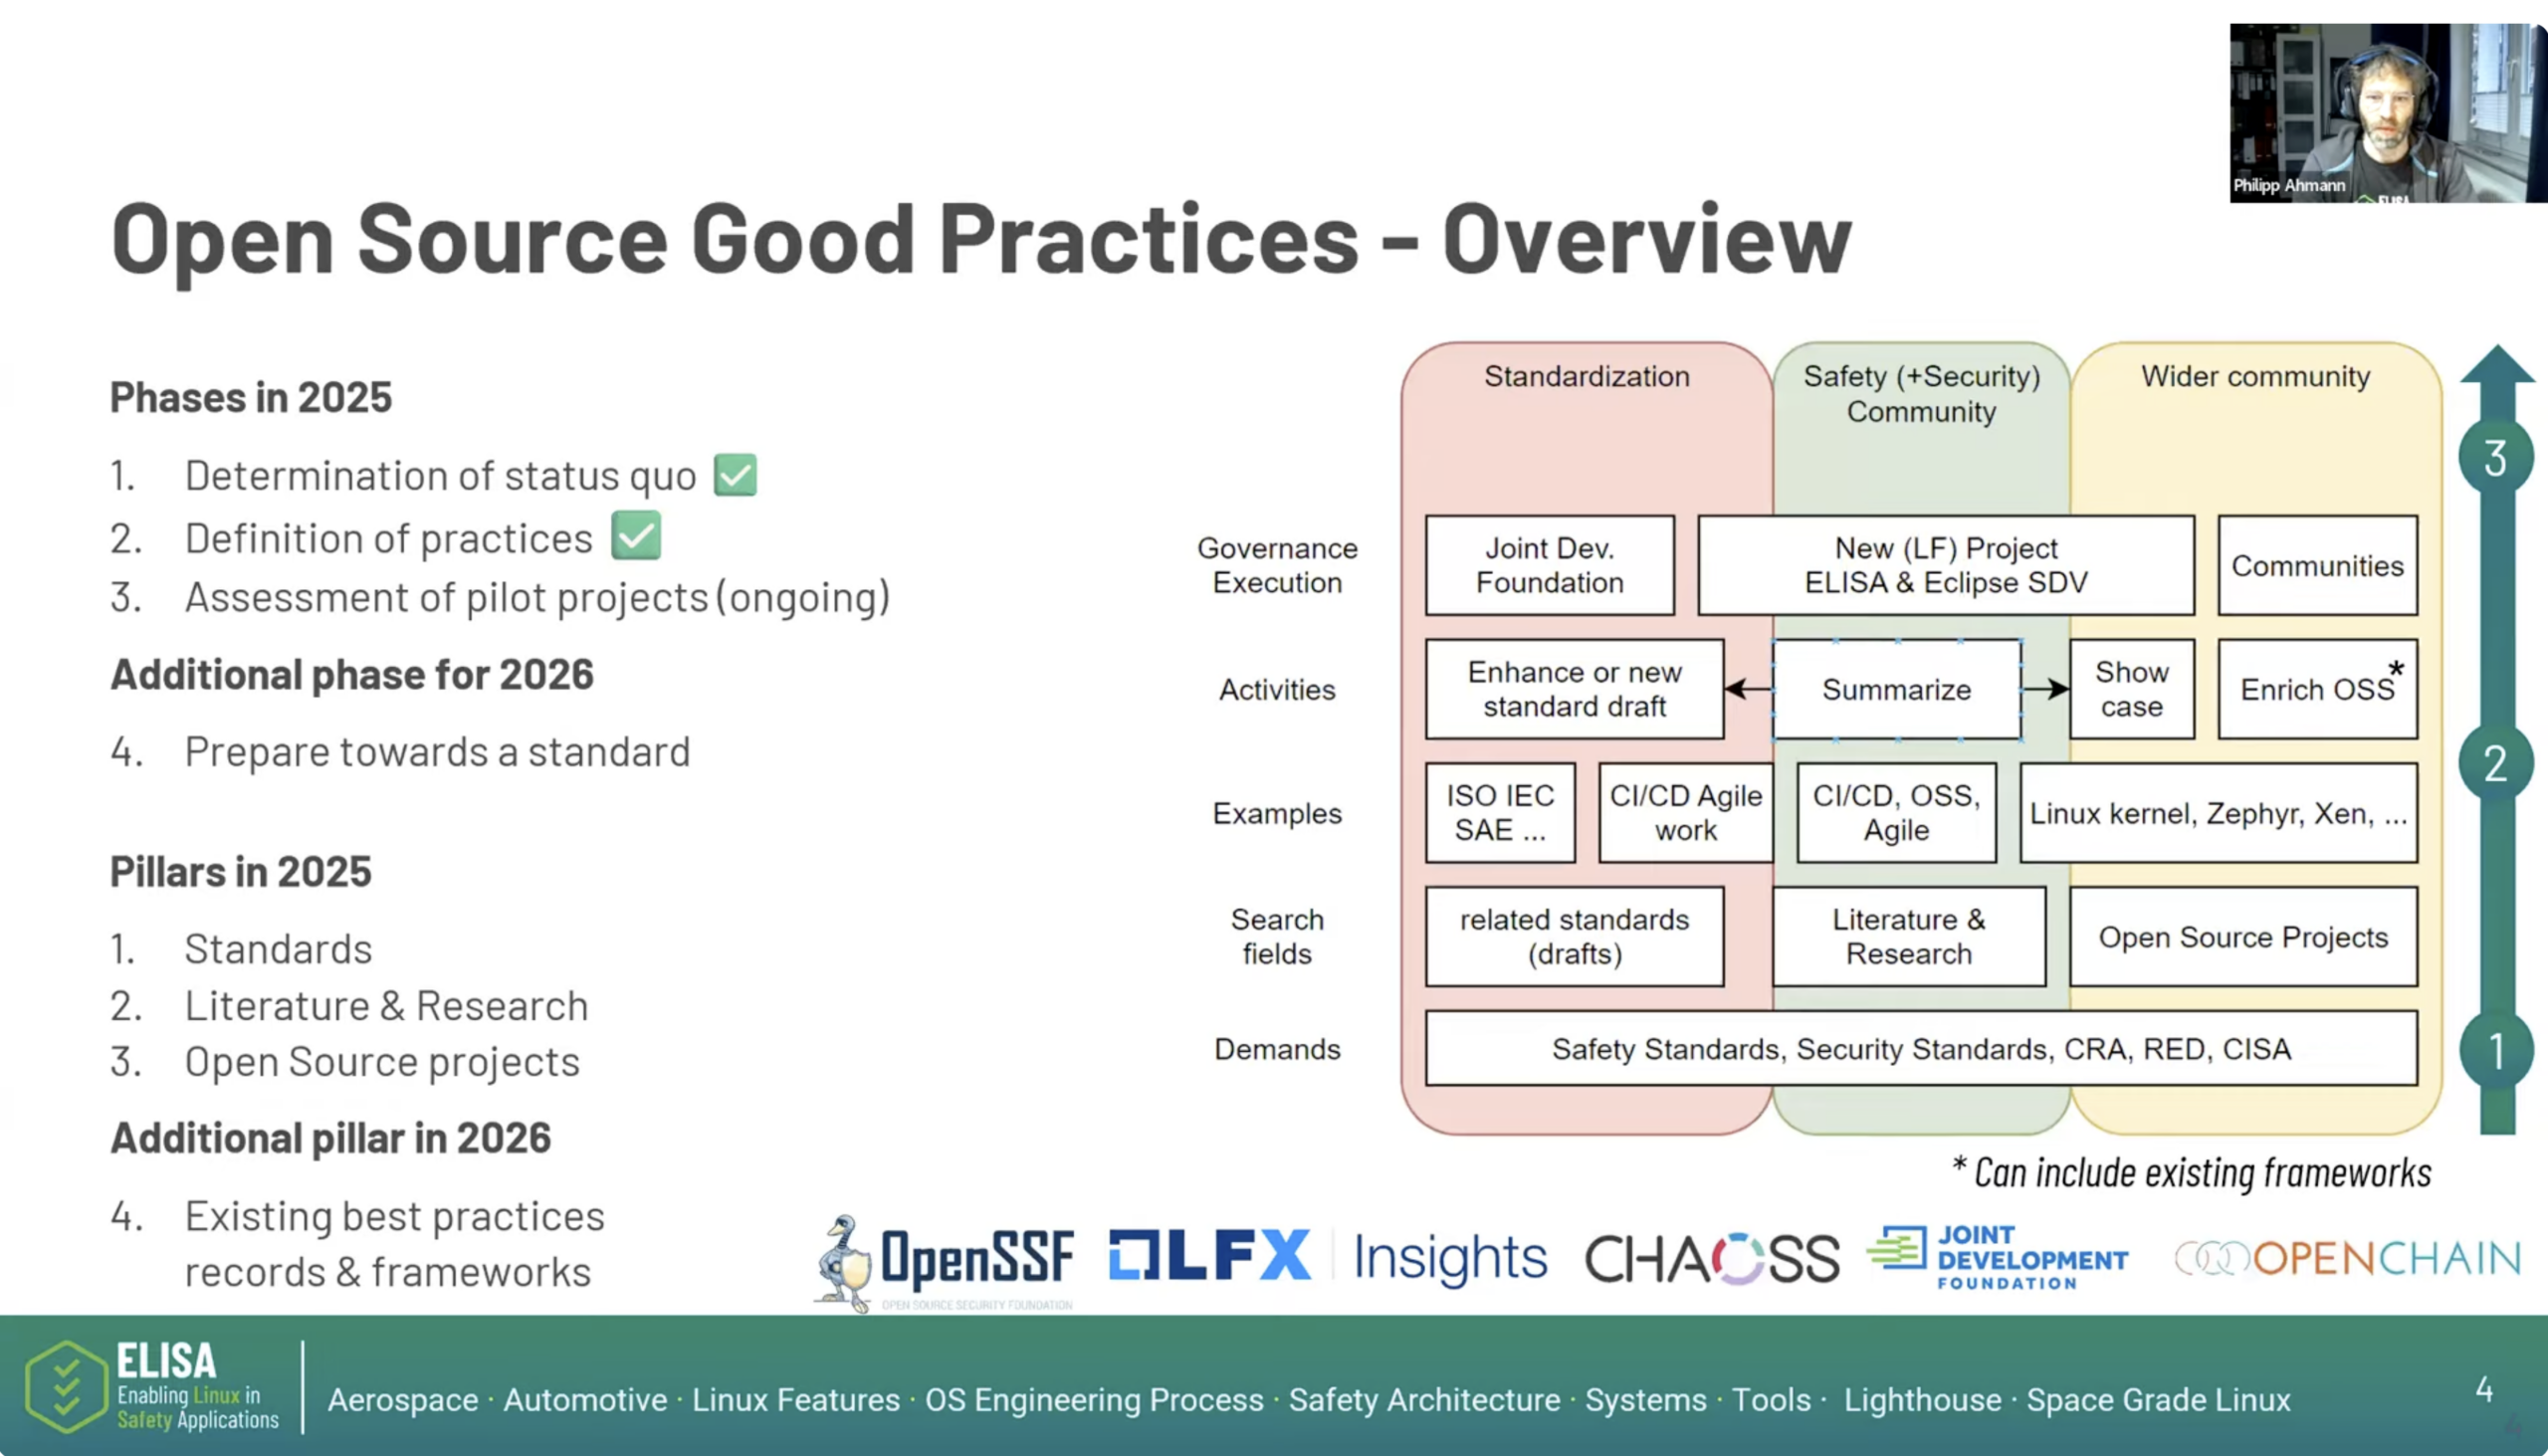
The Lighthouse SIG focuses on best practices for open source software in safety-critical systems. Philipp explained that many existing quality and safety standards were designed for proprietary software development, while open source communities often work through code-first, CI-driven, and agile processes. The group is exploring how established open source practices can be evaluated, documented, and eventually shaped into guidance or a standard that regulated industries can use.
In 2025, the SIG worked to understand the current landscape. The group reviewed existing safety, quality, and security standards, conducted literature research, and began assessing open source projects. Early work included creating a template to evaluate process robustness and evidence confidence across different criteria. Initial project assessments included Yocto, Xen, and LLVM, with plans to expand to projects such as Linux, curl, and OpenSSL.
The session also highlighted collaboration with other communities, including Eclipse automotive efforts, CHAOSS, OpenSSF Scorecard, LFX Insights, OpenSSF Best Practices, OpenChain, and the Joint Development Foundation. The goal is to avoid duplication, learn from existing work, and align with broader open source and standards communities.
Looking ahead to 2026, the Lighthouse SIG plans to refine its maturity model, review more projects, evaluate existing badges and scorecards, and continue preparing for possible standards work. The group is also exploring how to define and measure quality in open source projects more clearly.
Philipp closed by inviting new contributors to join the Lighthouse SIG. The group meets every other Friday and welcomes participation through its meetings, mailing list, Discord channel, GitHub repository, and meeting minutes.
Watch the full session to learn how the Lighthouse SIG is progressing and how you can get involved.
On February 11–12, the ELISA Project community gathered for the 2026 Working Group (WG) and Special Interest Group (SIG) Annual Updates. Over two focused sessions, group leads shared key milestones from 2025, current technical priorities, and what lies ahead in 2026, along with concrete opportunities for collaboration and contribution.
The annual updates serve as a checkpoint for the project: a moment to reflect on progress, align on priorities, and welcome new contributors into the work of advancing Linux in safety-critical systems.
This week we highlight the session on BASIL & Tools Working Group Evolution.
In this session from the ELISA Project Annual Updates, Luigi Pellecchia presents a recap of the BASIL tool’s development in 2025 and outlines planned directions for 2026. BASIL is described as a collaborative, web-based tool for traceability management, supporting multi-user environments, granular permissions, and detailed relationships between code, requirements, and test artifacts. It also integrates with internal and external test infrastructures and provides multiple export formats, including SPDX, HTML, and PDF.
The 2025 update highlights incremental improvements across the year, including enhancements to AI-assisted features, user experience refinements, support for importing external work items, and expanded browser compatibility. Infrastructure improvements include container optimization, security fixes, integration with additional testing frameworks, and the introduction of API code coverage monitoring. A major architectural change was the migration from SQLite to PostgreSQL to better support concurrent usage.
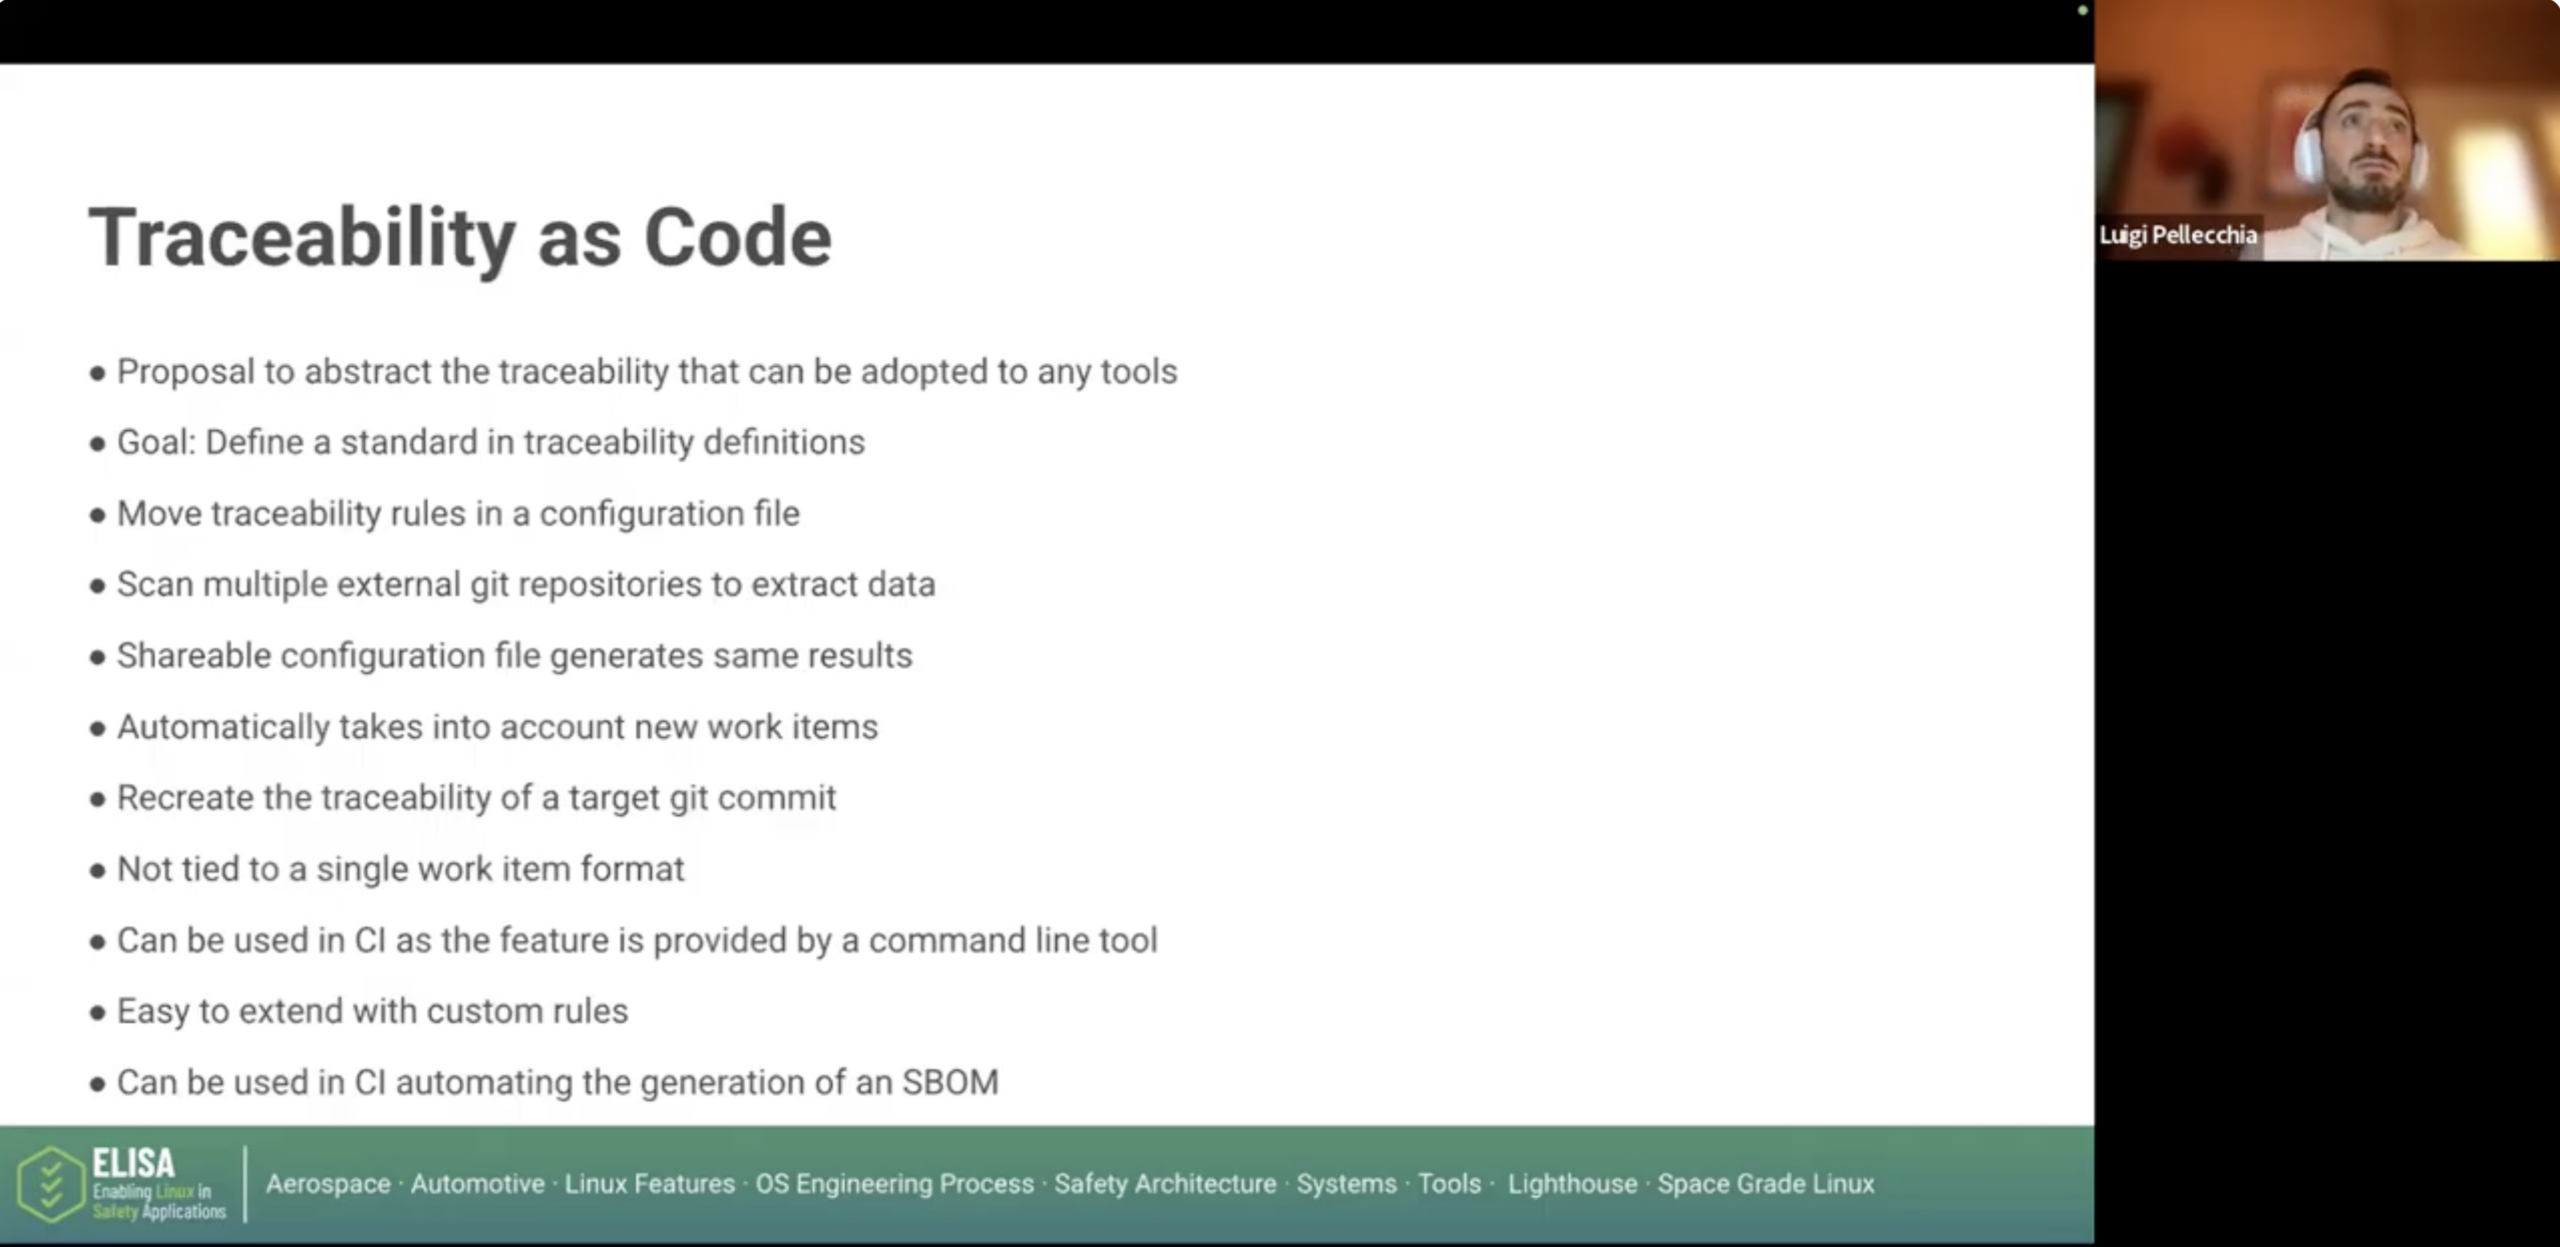
A key development in late 2025 is the introduction of “traceability as code,” an initial proposal to define traceability relationships through configuration files, enabling connections between distributed artifacts such as source code, test cases, and test results across different repositories and systems.
Looking ahead to 2026, planned efforts include extending traceability features (e.g., linking test results), introducing baseline snapshots of traceability states, improving test coverage, and continuing iterative development based on community feedback. The session also highlights available resources such as a public BASIL instance, documentation, and communication channels, and encourages community participation in both BASIL and the broader Tools Working Group.
Overall, the session focuses on the progress, ongoing development, and open collaboration around tooling to support traceability in safety-critical Linux environments.
Written by Shuah Khan, Linux Fellow at the Linux Foundation and member of the ELISA Project TSC
Key Points
Understanding system resources necessary to build and run a workload is important.
Linux tracing and strace can be used to discover the system resources in use by a workload.
Tracing OpenAPS commands with strace generated detailed view of system activity during the common run and helped with generating flowcharts for normal and error paths when commands detected device busy conditions.
Once we discover and understand the workload needs, we can focus on them to avoid regressions and evaluate safety.
OpenAPS is an open source Artificial Pancreas System designed to automatically adjust an insulin pump’s insulin delivery to keep Blood Glucose in a safe range at all times. It is an open and transparent effort to make safe and effective basic Automatic Pancreas System technology widely available to anyone with compatible medical devices who is willing to build their own system.
Broadly speaking, the OpenAPS system can be thought of performing 3 main functions. Monitoring the environment and operational status of devices with as much data relevant to therapy as possible collected, predicting what should happen to glucose levels next, and enacting changes through issuing commands, emails and even phone calls.
The ELISA Medical Devices Working Group has set out to discover the Linux kernel subsystems used by OpenAPS. Understanding the kernel footprint necessary to run a workload helps us focus on the subsystem and modules that make up the footprint for safety. We set out to answer the following questions:
What happens when an OpenAPS workload runs on Linux and discovers the subsystems and modules that are in active use when OpenAPS is running?
What are the interactions between OpenAPS and the kernel when a user checks how much insulin is left in the insulin pump?
Fine grained view of system activity
As mentioned earlier, the approach we gathered higher level of information about the OpenAPS usage. This higher information doesn’t tell us the system usage by individual OpenAPS commands. For example, watching the brain activity during the entire dinner vs. isolating the activity as we take the first bite of a delicious dessert and enjoy it.
Following up on our previous work, we gathered the fine grained information about individual OpenAPS commands and important use-cases. We used the strace commandto trace theOpenAPS commands based on the process we identified to trace a generic workload which is now in the Linux kernel user’s and administrator’s guide. We traced several OpenAPS commands on an OpenAPS instance running on RasPi managing a Medtronic Insulin Pump. “mdt” in the following text refers to the command provided by https://github.com/ecc1/medtronic:
Get Insulin Pump model (mdt model)
Get Insulin Pump time (mdt clock)
Get Insulin Pump battery (mdt battery)
Get Insulin Pump basal rate schedule (mdt basal)
Suspend Insulin Pump (mdt suspend)
Resume Insulin Pump (mdt resume)
Get the remaining insulin in the Insulin Pump reservoir (mdt reservoir)
Get Insulin Pump temporary basal rate (mdt tempbasal)
We ran these commands in normal mode and under strace to get summary (strace -c ) and complete trace (strace) information. The following shows a few selected commands, their output, trace information, and our analysis of the trace.
Running the command to get the remaining insulin in the reservoir
mdt reservoir &> reservoir.out # Get the remaining insulin in the reservoir
strace pumphistory -n 1 &> pumphistory.full # full trace
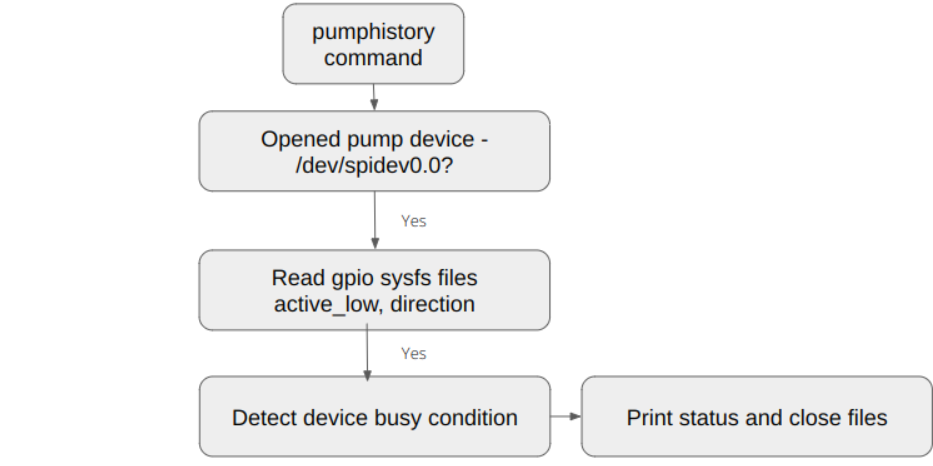
Output from the get pumphistory command
Run pumphistory command
retrieving pump history since 2022-10-12 10:54:03
cannot connect to CC111x radio on /dev/spidev0.0
null
/dev/spidev0.0: device is in use
Process startup (process mgmt)
Open files (fs -> driver sysfs)
Open pump device “/dev/spidev0.0”
Open “/sys/class/gpio/gpio4/active_low”
Open “/sys/class/gpio/gpio4/direction”
Close files (fs -> driver sysfs)
Exit program (process mgmt)
This output shows that the pump busy path is invoked
Pump history command flowchart
Complete strace -c output
2022/10/12 11:54:03 retrieving pump history since 2022-10-12 10:54:03
2022/10/12 11:54:03 cannot connect to CC111x radio on /dev/spidev0.0
null
2022/10/12 11:54:03 /dev/spidev0.0: device is in use
% time seconds usecs/call calls errors syscall
—— ———– ———– ——— ——— —————-
40.92 0.003106 25 120 rt_sigaction
15.91 0.001208 109 11 futex
8.09 0.000614 204 3 clone
7.84 0.000595 59 10 mprotect
7.52 0.000571 190 3 fcntl
5.23 0.000397 44 9 rt_sigprocmask
5.20 0.000395 17 22 mmap2
4.23 0.000321 321 1 readlinkat
3.77 0.000286 13 21 clock_gettime
1.29 0.000098 24 4 brk
0.00 0.000000 0 5 read
0.00 0.000000 0 4 write
0.00 0.000000 0 7 close
0.00 0.000000 0 1 execve
0.00 0.000000 0 1 getpid
0.00 0.000000 0 1 access
0.00 0.000000 0 1 readlink
0.00 0.000000 0 2 munmap
0.00 0.000000 0 1 uname
0.00 0.000000 0 1 1 flock
0.00 0.000000 0 2 sigaltstack
0.00 0.000000 0 1 ugetrlimit
0.00 0.000000 0 5 fstat64
0.00 0.000000 0 1 gettid
0.00 0.000000 0 1 sched_getaffinity
0.00 0.000000 0 1 set_tid_address
0.00 0.000000 0 7 openat
0.00 0.000000 0 1 set_robust_list
0.00 0.000000 0 1 set_tls
—— ———– ———– ——— ——— —————-
100.00 0.007591 248 1 total
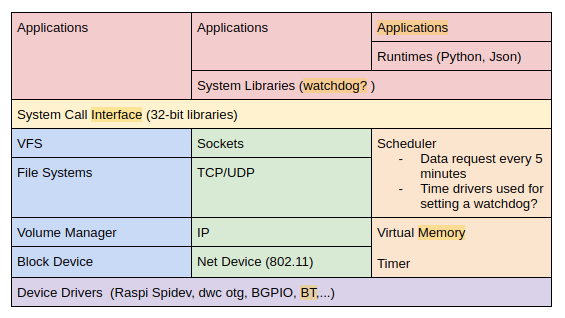
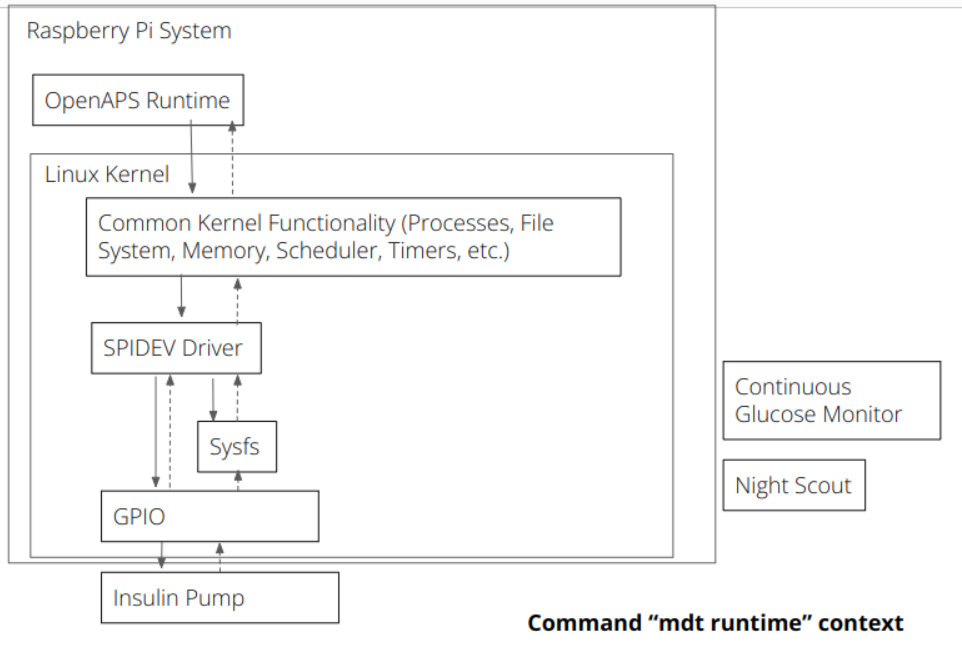
The following diagram shows the run-time context for these commands and their mapping to the Linux subsystems used by them.
System view
The following system view was updated after high level tracing analysis. This system view remains unchanged after the fine grained tracing analysis as expected.
Using strace to trace OpenAPS commands helped us understand the detailed view of system files opened and closed while the commands run. We were able to generate flowcharts for normal and error paths when commands detected device busy conditions. As mentioned earlier, this tracing method gave us insight into the parts of the kernel used by the individual OpenAPS commands.
Credits
The ELISA Medical Working Group would like to sincerely acknowledge Chance Harrison for running the OpenAPS commands and providing information critical for making this effort a successful one.
SPDX-License-Identifier: CC-BY-4.0
This document is released under the Creative Commons Attribution 4.0 International License, available at https://creativecommons.org/licenses/by/4.0/legalcode. Pursuant to Section 5 of the license, please note that the following disclaimers apply (capitalized terms have the meanings set forth in the license). To the extent possible, the Licensor offers the Licensed Material as-is and as-available, and makes no representations or warranties of any kind concerning the Licensed Material, whether express, implied, statutory, or other. This includes, without limitation, warranties of title, merchantability, fitness for a particular purpose, non-infringement, absence of latent or other defects, accuracy, or the presence or absence of errors, whether or not known or discoverable. Where disclaimers of warranties are not allowed in full or in part, this disclaimer may not apply to You.
To the extent possible, in no event will the Licensor be liable to You on any legal theory (including, without limitation, negligence) or otherwise for any direct, special, indirect, incidental, consequential, punitive, exemplary, or other losses, costs, expenses, or damages arising out of this Public License or use of the Licensed Material, even if the Licensor has been advised of the possibility of such losses, costs, expenses, or damages. Where a limitation of liability is not allowed in full or in part, this limitation may not apply to You.
The disclaimer of warranties and limitation of liability provided above shall be interpreted in a manner that, to the extent possible, most closely approximates an absolute disclaimer and waiver of all liability.
Written by Shuah Khan, Linux Fellow at the Linux Foundation and member of the ELISA Project TSC, and Shefali Sharma, a senior student at the Meerut Institute of Engineering and Technology in India and ELISA Project Mentee in 2022
Key Points
Understanding system resources necessary to build and run a workload is important.
Linux tracing and strace can be used to discover the system resources in use by a
workload. The completeness of the system usage information depends on the
completeness of coverage of a workload.
Performance and security of the operating system can be analyzed with the help of tools such as:
Once we discover and understand the workload needs, we can focus on them to avoid regressions and use it to evaluate safety considerations.
We set out to identify methodology to discover system resources necessary to build and run workload and document the process. Easily available workloads are used to test out methodology and to document the process. This process is intended to be used as a guide on how to gather fine-grained information on the resources in use by workloads.
Within the ELISA project the methodology goes into scaling, by hardening and extending the guidelines in other working groups. The achievements from the Medical Devices Working Group will be taken and put into practice within the Automotive WG use case analysis focusing on safety critical display rendering.
The workload-tracing guide is now available in Linux 6.3 release. It is intended to be used as a guide on how to gather fine-grained information on the resources in use by workloads using strace.
Written by Igor Stoppa, Senior Software Architect at Nvidia
For more than two decades, Linux has made inroad in new fields of applications, from data centres, to embedded. We see now a growing demand for Linux in safety critical applications, ranging from automotive to robotics, to medical appliances.
However, Linux was not designed with these applications in mind, and unsurprisingly it is not an ideal fit, at the moment.In particular, one major pain point is the very limited resilience to spatial interferences originating from within the kernel itself.
Furthermore, the code base if much larger than what can be found in other operating systems traditionally found in safe applications. This is also compounded by the fact that Linux does not follow the processes traditionally in use for Functional Safety.
Summary
In the video, I describe my ongoing experiment of modifying the Linux kernel, to introduce a form of Address Space Isolation, meant to provide a mechanism enforcing freedom from interference. The presentation describes the problems, possible means to address it, and the current progress with the implementation. You’ll see a methodology for the safety analysis of a Linux system and mechanism for improving the safety of selected components.
This presentation ties both into the scope of the Linux Features for Safety-Critical Systems Working Group and the Critical SW track at Open Source Summit Europe. Though this work is not formally sponsored nor endorsed by ELISA, it is something I shared with the community for brainstorm and discussion purposes.
If you’d like to learn more about the Linux Features for Safety-Critical Systems Working Group or you’d like to continue this conversation, please join the mailing list or a WG meeting here.
Written by Shuah Khan, Chair of the ELISA Project Technical Steering Committee
Please join me in welcoming Jason Smith, Paul Albertella and Philipp Ahmann to the ELISA TSC. They have made significant contributions to the ELISA project and their addition will strengthen the TSC and help us continue to make progress with our mission.
A brief summary of their background and contributions are as follows:
Jason Smith
Jason Smith, the Principal Engineer for Robotics and Control Systems Consumer Technology at UL LLC., has:
– Contributed a Linux in Basic Safety White paper to the project
– Participates in the Medical Devices Working Group regularly
– Contributed the analysis of 62304 SOUP
– Speaks frequently at ELISA Workshops and is an ELISA ambassador
Paul Albertella
Paul Albertella, Consultant at Codethink, has:
– Participated in ELISA since the inception.
– Presented technical content at the last two ELISA workshops
– Contributes in the TSC and other working groups, where he’s been a constructive collaborator
– 20+ years of software engineering experience and understands the open source ecosystem challenges
Philipp Ahmann
Philipp Ahmann, a manager at ADIT (a joint venture of Robert Bosch GmbH and DENSO Corporation) has:
– Participated in ELISA since the start of the project
– Took the lead in helping the project to improve communication and set up our LinkedIn presence
– Volunteered to be an active ambassador on behalf of the project
– Participates in the TSC and other working groups, where he’s known to be a very constructive contributor with an excellent overview across all the different areas we’re working on
– Demonstrates a helpful attitude by being willing to step in and host meetings when the chair is not available
– He is able to actively listen, and helps bring focus to the key elements we need for the project
I look forward to collaborating more closely with all three of our new TSC members. As a reminder, all are welcome to join the bi-weekly public technical community meeting and to contribute your perspectives. You can find the meeting details and subscribe to the calendar here: https://lists.elisa.tech/g/devel/calendar.