

Written by Shuah Khan, Chair of the ELISA Project Technical Steering Committee, and Milan Lakhani, member of the ELISA Medical Devices Working Group
Key Points
- Understanding system resources necessary to build and run a workload is important.
- Linux tracing and strace can be used to discover the system resources in use by a workload.
- Once we discover and understand the workload needs, we can focus on them to avoid regressions and evaluate safety.
OpenAPS is an open source Artificial Pancreas System designed to automatically adjust an insulin pump’s insulin delivery to keep Blood Glucose in a safe range at all times.
It is an open and transparent effort to make safe and effective basic Automatic Pancreas System technology widely available to anyone with compatible medical devices who is willing to build their own system.
Broadly speaking, the OpenAPS system can be thought of performing 3 main functions. Monitoring the environment and operational status of devices with as much data relevant to therapy as possible collected, predicting what should happen to glucose levels next, and enacting changes through issuing commands, emails and even phone calls.
ELISA Medical Devices WG team has set out to discover the Linux kernel subsystems used by OpenAPS. Understanding the kernel footprint necessary to run a workload helps us focus on the subsystem and modules that make up the footprint for safety. We set out to answer the following questions:
- What happens when an OpenAPS workload runs on Linux?
- What are the subsystems and modules that are in active use when OpenAPS is running?
- What are the interactions between OpenAPS and the kernel when a user checks how much insulin is left in the insulin pump?
So how do we discover the Linux kernel subsystem in use? The Linux kernel has several features and tools that can help discover which modules and functions are being used by an application during run-time. Using these tools, we can gather the system state while the OpenAPS workload is running to determine which parts of the kernel are being used.
Let’s talk a bit about kernel states. The kernel system state can be viewed as a combination of static and dynamic features and modules. Let’s first define what static and dynamic system states are and then explore how we can visualize the static and dynamic system parts of the kernel.
Static System View comprises system calls, features, static modules and dynamic modules enabled in the kernel configuration. Supported system calls and Kernel features are architecture dependent. System call numbering is different on different architectures. We can get the supported system call information using the auditd package tool. ausyscall –dump prints out the supported system calls on a system. You can install the auditd package by running “sudo apt-get install auditd” on Debian systems. Linux kernel script scripts/checksyscalls.sh can be used to check if current architecture is missing any function calls compared to i386. scripts/get_feat.pl <get_feat.pl list> can be used to list the Kernel feature support matrix for a system or get_feat.pl list –arch=arm for example lists the Kernel feature support matrix of the ‘arm’ architecture
Dynamic System View comprises system calls, ioctls invoked, and subsystems used during the runtime. A workload could load and unload modules and also change the dynamic system configuration to suit its needs.
OpenAPS Static View
Let’s first look at the OpenAPS sources to understand the workload from a static view. The OpenAPS workload is a collection of python libraries, python-dev, software-properties-common, python-software-properties, python-numpy, python-pip, nodejs-legacy and npm. You can have a look at the OpenAPS repositories in https://github.com/openaps with the two main ones being https://github.com/openaps/oref0 and https://github.com/openaps/openaps . The initial dependencies that the user installs can be seen here https://github.com/openaps/docs/blob/master/scripts/quick-packages.sh
One easier way to understand its runtime characteristics is watching the system state while a workload is running. We determined that the following methodology and tools would work well for us to observe the system activity.
What is the methodology?
The first step is gathering the default system state such as the dynamic and static modules loaded on the system. lsmod command prints out the dynamically loaded modules on a system. Statically configured modules can be found in the kernel configuration file. Understanding the default system is necessary to determine the changes if any made by the workload.
The next step is discovering the Linux kernel footprint used by OpenAPS by enabling event tracing before starting the workload, gathering dynamic modules while the workload is running. Once the workload is stopped, gather the event logs, kernel messages.
Once we have the necessary information, we can extract the system call numbers from the event trace log and map them to the supported system calls.
Putting our methodology to test
Our initial plan was to use strace to trace system calls and signals used by OpenAPS commands in strace. strace runs the specified command until it exits. It intercepts and records the system calls which are called by the process and the signals which are received by the process. It gives insight into the syscalls OpenAPS commands use. However, we realized quickly that OpenAPS employs setup scripts to launch its workload. As a result, using strace was not an option.
We modified OpenAPS oref0-setup.sh in https://github.com/OpenAPS/oref0.git to enable event tracing before OpenAPS starts its workload (processes, shell scripts). This approach gives us an overall information about OpenAPS. We will develop a higher level view and then dive into individual OpenAPS commands..
==================================================================
diff –git a/bin/oref0-setup.sh b/bin/oref0-setup.sh
index 261da95b..5ae666e2 100755
— a/bin/oref0-setup.sh
+++ b/bin/oref0-setup.sh
@@ -1269,6 +1269,11 @@ if prompt_yn “” N; then
fi # from ‘read -p “Continue? y/[N] ” -r’ after interactive setup is complete
+# ELISA enable event tracing
+echo “ELISA: Enable event tracing on all events”
+echo 1 > /sys/kernel/debug/tracing/events/enable
+cat /sys/kernel/debug/tracing/events/enable
+
# Start cron back up in case the user doesn’t decide to reboot service cron start
==================================================================
We were able to gather traces with the above modification to oref0-setup.sh. As mentioned earlier, the ausyscall tool dumps out mapping for syscalls and their corresponding syscall table numbers. The mapping is architecture dependent for some system calls. The trace data includes NR followed by a number in the trace file. These are the syscalls that are run during the time the tracing was on. Using the tracing and system call information, we determined the system calls used by the OpenAPS workload. In addition we used scripts/checksyscalls.sh to check for system call support status on RasPi.
What did we do to gather traces and system state?
- Start OpenAPS workload with modified the modification to enable tracing
- Let the workload run for 30 minutes
- Discard last 5 minutes of trace from analysis to account for interference (rsync and plugging devices) with trace file extraction
- Stop OpenAPS.
- Extract trace file from the system – cat /sys/kernel/debug/tracing/trace > trace.out
- Run lsmod after OpenAPS workload starts to gather module information
- Run “ausyscall –dump > syscalls_dump.out”
Analyzing traces:
- Map the NR (syscal) numbers from the trace to syscalls from the syscalls dump.
- Categorize system calls and map them to Linux subsystems.
Findings and observations:
- ioctls in use are all spidev ioctls. OpenAPS python modules use spidev interfaces.
- Raspi SPI Dev and Python Spidev use (914 spidev ioctls invoked)
- CONFIG_SPI, SPI_BCM2835 options enabled.
- Heavy use of syscall32
- Use scripts/checksyscalls.sh to check for support status
Kernel module usage:
| Module Name | Usage count (OpenAPS) | Usage count (default) |
| cmac | Not loaded | 1 |
| ecdh_generic | 1 (bluetooth) | 2 (bluetooth) |
| ecc | 1 (ecdh_generic) | 1 (ecdh_generic) |
| spidev | 2 | Not loaded |
| i2c_bcm2835 | 1 | Not loaded |
| spi_bcm2835 | 0 | Not loaded |
| i2c_dev | 2 | Not loaded |
| ipv6 | 26 | 24 |
Subsystem usage:
| Subsystem | # of calls |
| kmem_* | 200990 |
| mm_* | 182471 |
| sched_* | 195241 |
| rcu_* | 223011 |
| irq_* | 1781503 |
| kmalloc | 79801 |
| cpu_idle | 62623 |
| rss_stat | 22130 |
| ipi_* | 42514 |
| sys_* | 148034 |
| vm_* | 60489 |
| task_* | 72813 |
| timer_ | 58572 |
| hrtimer_* | 152271 |
| softirq_* | 28860 |
| workqueue_* | 6129 |
| writeback_* | 3933 |
| ext4_* | 34461 |
| jbd2_* | 2062 |
| block_* | 3590 |
| dwc_otg* | 27701 |
| arch_timer | 13446 |
Updated System view:
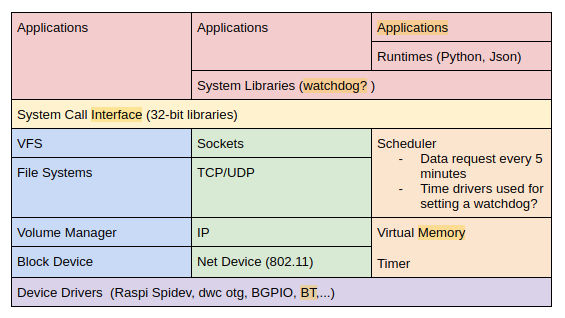
Conclusion
This tracing activity was a good way of identifying which parts of the kernel are used by OpenAPS. This helped to generate the Updated system view, so it is useful for our goal to do an STPA analysis of OpenAPS Operating System activity. We plan to theoretically analyse how these different subsystems can interact unsafely, while using fault injection and mocked components to collect more traces.
As mentioned earlier, the approach we used so far gave us a higher level of information about the OpenAPS usage. It isn’t ideal that this higher information doesn’t tell us the system usage by individual OpenAPS commands. As an example, we won’t be able to clearly identify which system calls are invoked when a user queries insulin pump status.
We are in the process of gathering fine grained information about individual OpenAPS commands and important use-cases. As an example, what subsystems are used when a user queries the insulin pump status. We are using the strace command to trace the OpenAPS commands. We will share our findings in our next blog on this topic.
SPDX-License-Identifier: CC-BY-4.0
This document is released under the Creative Commons Attribution 4.0 International License, available at https://creativecommons.org/licenses/by/4.0/legalcode. Pursuant to Section 5 of the license, please note that the following disclaimers apply (capitalized terms have the meanings set forth in the license). To the extent possible, the Licensor offers the Licensed Material as-is and as-available, and makes no representations or warranties of any kind concerning the Licensed Material, whether express, implied, statutory, or other. This includes, without limitation, warranties of title, merchantability, fitness for a particular purpose, non-infringement, absence of latent or other defects, accuracy, or the presence or absence of errors, whether or not known or discoverable. Where disclaimers of warranties are not allowed in full or in part, this disclaimer may not apply to You.
To the extent possible, in no event will the Licensor be liable to You on any legal theory (including, without limitation, negligence) or otherwise for any direct, special, indirect, incidental, consequential, punitive, exemplary, or other losses, costs, expenses, or damages arising out of this Public License or use of the Licensed Material, even if the Licensor has been advised of the possibility of such losses, costs, expenses, or damages. Where a limitation of liability is not allowed in full or in part, this limitation may not apply to You.
The disclaimer of warranties and limitation of liability provided above shall be interpreted in a manner that, to the extent possible, most closely approximates an absolute disclaimer and waiver of all liability.